Results by department
Select a department (Auvergne-Rhône-Alpes only)
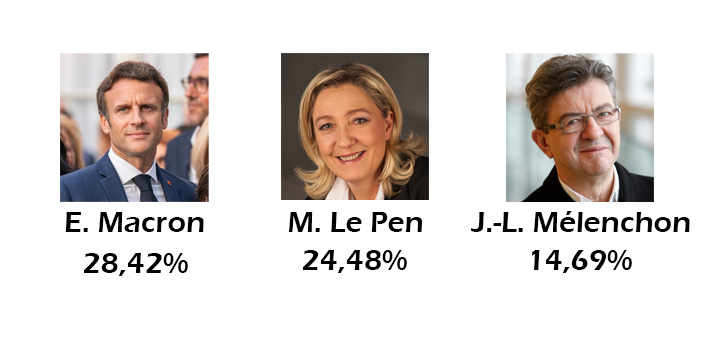
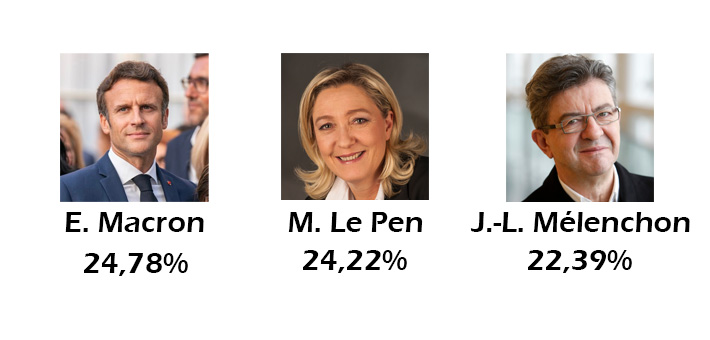
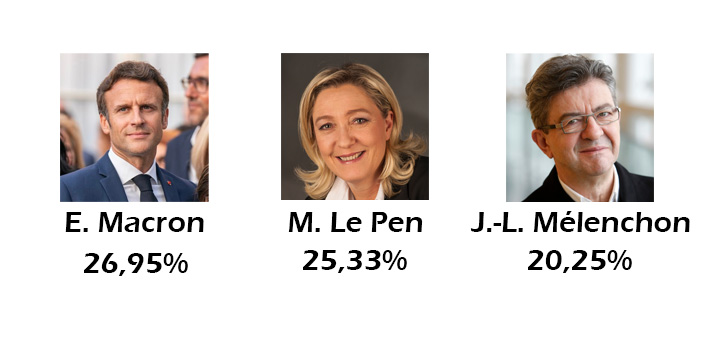
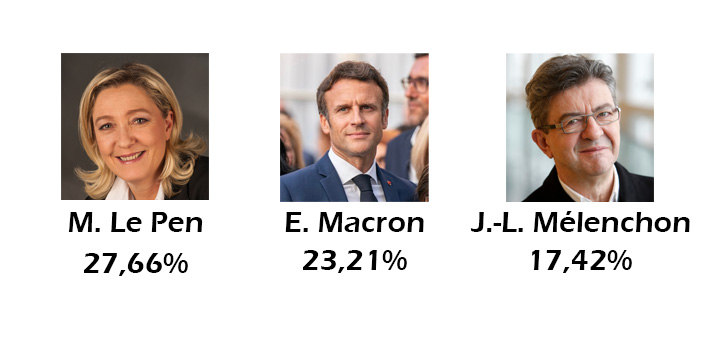
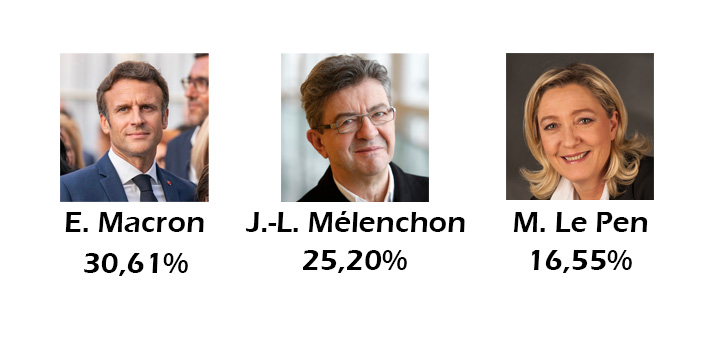
The three candidates with the highest percentages are shown.


The first round results by region of France
Presidential elections permit French people to elect a President of the Republic.
His role is to represent the country, he is the head of the armed forces and manages diplomacy between the France and other countries. It must also uphold the Constitution and does not govern alone. He is elected for a term of 5 years and can renew his term only once.
Elections happen in two rounds. It is a direct universal suffrage: French citizens, both men and women, can vote from the age of 18.
The two candidates with the highest number of votes advance to the second round, eliminating the other candidates. In the second round, the one with the majority wins the election.
On that day, the French are called to vote among the 12 candidates on the list.
At 8 p.m. of the same day, the results given at the national level:
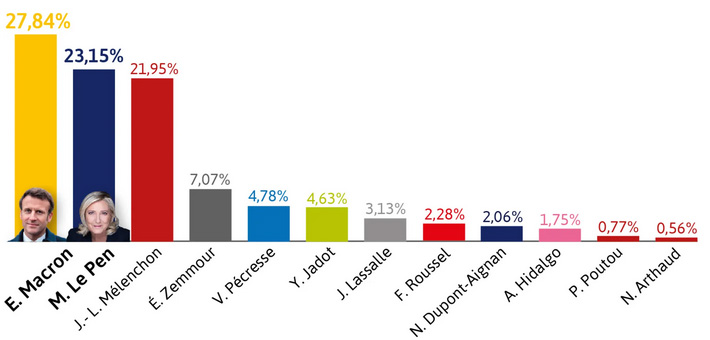
Source : Ministry of the Interior
The two people going to the second round are Emmanuel Macron and Marine Le Pen.
Select a department (Auvergne-Rhône-Alpes only)
The three candidates with the highest percentages are shown.
What is a region's contribution? This is the percentage of the region participates in the results of the election and the candidates. This makes it possible to know the extent to which a region contributed to the national results, the distribution of voters by department as well as the trends of the departments in the region.
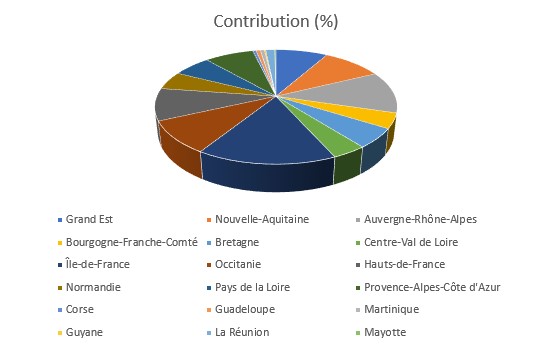
Here we have a pie chart representing the contribution of the regions in number of registrants. The largest contribution is the Ile-de-France region, which contributes 15.6% of the national results. The Auvergne-Rhône-Alpes region contributes 11.8%.
The Auvergne-Rhône-Alpes region is composed of 12 departments: Ain, Allier, Ardèche, Cantal, Drôme, Isère, Loire, Haute-Loire, Puy-de-Dôme, Rhône, Savoie and Haute-Savoie. It is a very heterogeneous region in terms of population density, alternating rural areas and urban areas of large cities.
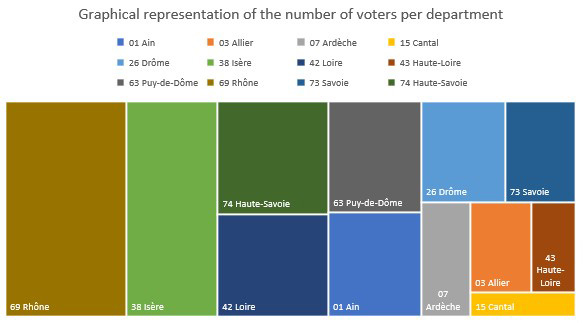
This graph represents the number of people registered to vote by department. We can see that the most populated department is the Rhône, and the least populated is Cantal. A total of 5557535 people are registered to vote in the region.
From here, we count only E. Macron, M. Le Pen and J.-L. Mélenchon in the calculations. These are the candidates with the highest score in all departments.
Which department contributed the most to M. Le Pen's score? The score of E. Macron?
For this, we take the number of voters of E. Macron by department and then divided by the sum of the voters of the region of this candidate. It is multiplied by 100 to have a percentage. For example for Ain: The number of voters of E. Macron is 92206, out of 1174972 in the region.This gives him a contribution of 7.8% for this candidate. This process is to be done for all departments, for the 3 candidates.
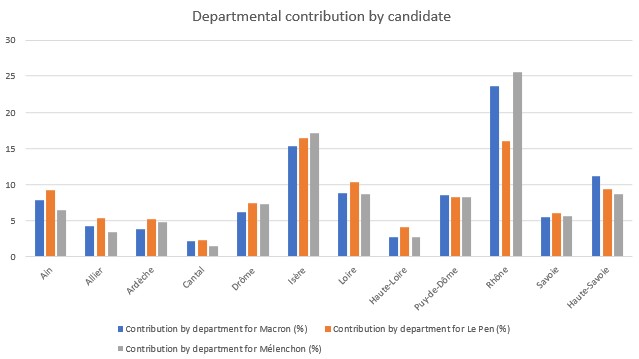
Here's what you get: The department contributing the most to the results of E. Macron and J.-L. Mélenchon is the Rhone. The department contributing the most to M. Le Pen's results is Isère. On the contrary, the lowest contributions are from Haute-Loire and Cantal. This is explained by the population density much lower than the Rhône.
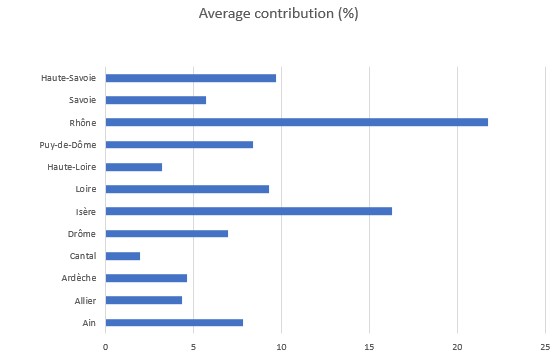
To what percentage do the departments contribute to the 11.6% contribution of the region? For this, we take the contribution of the 3 candidates in each department that we add. We divide by 3 in order to make an average.
How are the voters of the candidates distributed in the region?
For this, the standard deviation is used. All percentages of the candidate's contribution by departments are selected. The closer the result is to 0, the more evenly the voters are distributed across the region. On the contrary, the higher the standard deviation, the more locally concentrated voters are distributed.
The standard deviation of M. Le Pen's electorate is 4.35, that of E. Macron is 6.1 and that of J.-L. Mélenchon is 6.7.
As for M. Le Pen, her voters are more evenly scattered across the Region than those of the other candidates. All departments contribute to this fairly uniformly. Regarding the other two candidates, their voters are more focused on certain departments, and not others. Some departments contribute little while others contribute a lot. This phenomenon is more important with the electorate of J.-L. Mélenchon with a higher standard deviation.